How to collect MikroTik HTTP logs for a web dashboard
Set up MikroTik web-proxy logging, send requests to a UDP receiver, and prepare the records for a searchable web dashboard.
Start with one HTTP request. Get MikroTik to log it, send the message to your server, and check that it arrives. Once that works, you have something to store and display on a web page.
This walkthrough covers the router settings and a small UDP receiver you can use to check the connection. You can replace that receiver with your own backend or an existing log collector. The router doesn’t need to know which frontend framework you’ve become attached to this week.
What we’re collecting
This walkthrough uses a transparent HTTP proxy. It sees plain HTTP requests that pass through that proxy. It does not reveal the full URLs or contents of ordinary HTTPS browsing. Sending port 443 to the HTTP proxy will break those connections rather than make them readable. MikroTik documents that boundary in its Web Proxy guide.
So think of the dashboard as a view of the requests you collected. A request count isn’t a count of people or deliberate page visits; one page can make several requests.
The flow has two paths:
HTTP request:
Test client → router's NAT rule → web proxy → web server

Log message:
Web proxy → logging rule → UDP receiver → storage → web UI
We’ll configure a remote logging action, choose the proxy messages to send, and redirect one test client’s HTTP traffic through the proxy.
Give the logs an address
Use a test router or an isolated network you administer. These are example addresses; replace them with your own before entering commands.
| Setting | Example | Purpose |
|---|---|---|
| Router LAN address | 192.168.88.1 |
Gateway for the test client |
| Test client | 192.168.88.10 |
The only client captured by our NAT rule |
| Receiver | 192.168.88.20 |
Machine accepting logs from the router |
| Log port | UDP 3100 |
Must match at both ends |
| Proxy port | TCP 8080 |
HTTP requests arrive here after redirection |
The client must use this router as its gateway. Keep the receiver address stable, make sure the router can reach it, and allow UDP 3100 on the receiver only from the router. The web interface’s HTTP port is a separate setting.
In Winbox, open System → Logging → Actions, then add a remote action. Name it WEBLOG, choose your receiver’s address, and set the remote port to 3100. Select the Syslog format, shown as BSD Syslog in older Winbox versions.
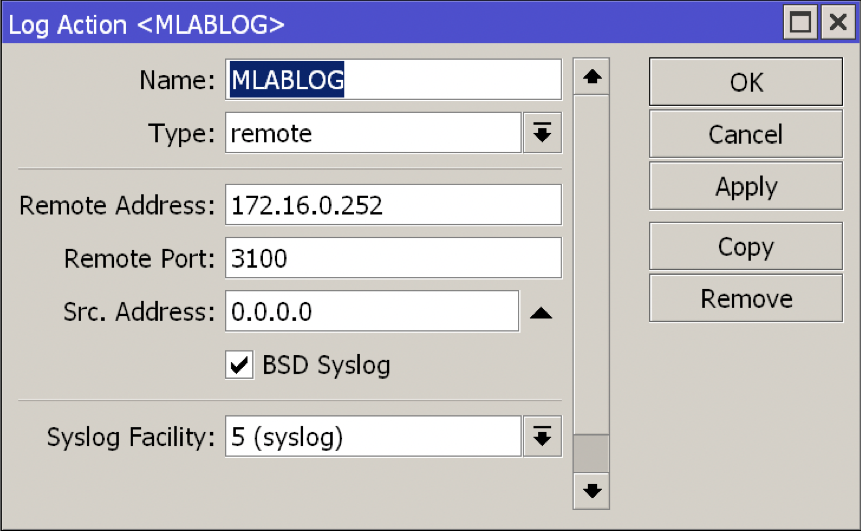
Set the destination to your receiver. The action name and address in this screenshot are examples; use WEBLOG and your own address for this walkthrough. Tap any screenshot to enlarge it.
On current RouterOS, the equivalent action for our example is:
/system logging action add name=WEBLOG target=remote \
    remote=192.168.88.20 remote-port=3100 \
    remote-log-format=syslog remote-protocol=udp
These CLI examples follow the RouterOS 7.26 manual; the screenshots show an older Winbox interface. Older releases expose BSD Syslog as bsd-syslog=yes instead of remote-log-format=syslog, and may not have remote-protocol. Use your installed version’s available fields. The current logging action reference describes the format and transport settings.
Create this action once. If WEBLOG already exists, inspect it and edit it instead of adding a duplicate.
Tell MikroTik which messages to send
Back in System → Logging → Rules, add a rule with the topic web-proxy, exclude debug, and select your remote action.
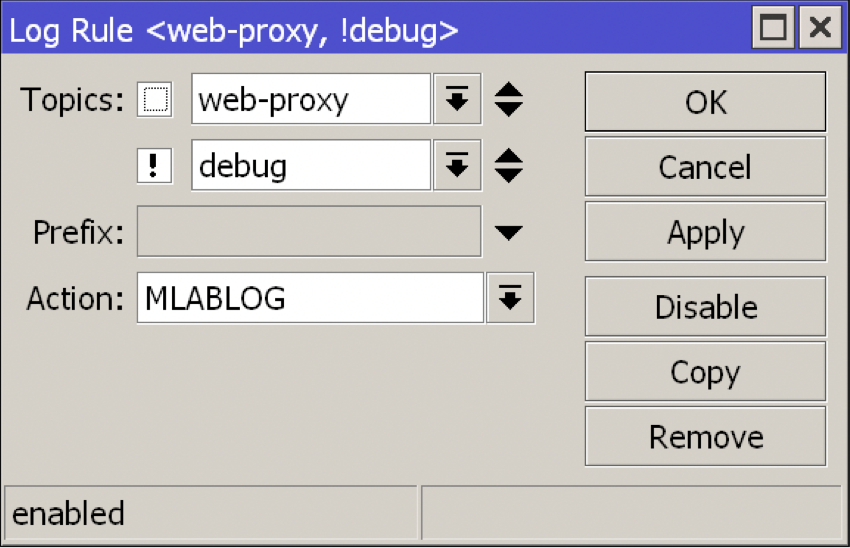
The exclamation mark before debug means exclude it. Select WEBLOG as the action so matching messages reach your receiver.
/system logging add topics=web-proxy,!debug action=WEBLOG \
    comment="diary-http-log"
The rule picks the messages; the action picks their destination. Keep debug excluded for this walkthrough. We want request records, without collecting the extra request and response headers that proxy debug logging can include.
Route one client’s HTTP traffic through the proxy
First inspect your existing firewall and proxy settings. Save the current configuration so you can restore it. The commands below are for a lab with no existing proxy service; a router already running a proxy needs its existing access rules preserved and reviewed.
Before enabling the proxy, restrict who can reach TCP 8080. In IP → Firewall → Filter Rules, put an input-chain allow rule for your test client’s /32 address and its LAN interface above a rule dropping other input to TCP 8080. Both must precede broader accept rules. Protect the same port in the IPv6 input firewall too; this walkthrough only redirects IPv4 traffic. A WAN port-forward is not needed.
Then open IP → Web Proxy, enable it, and set the port to 8080.
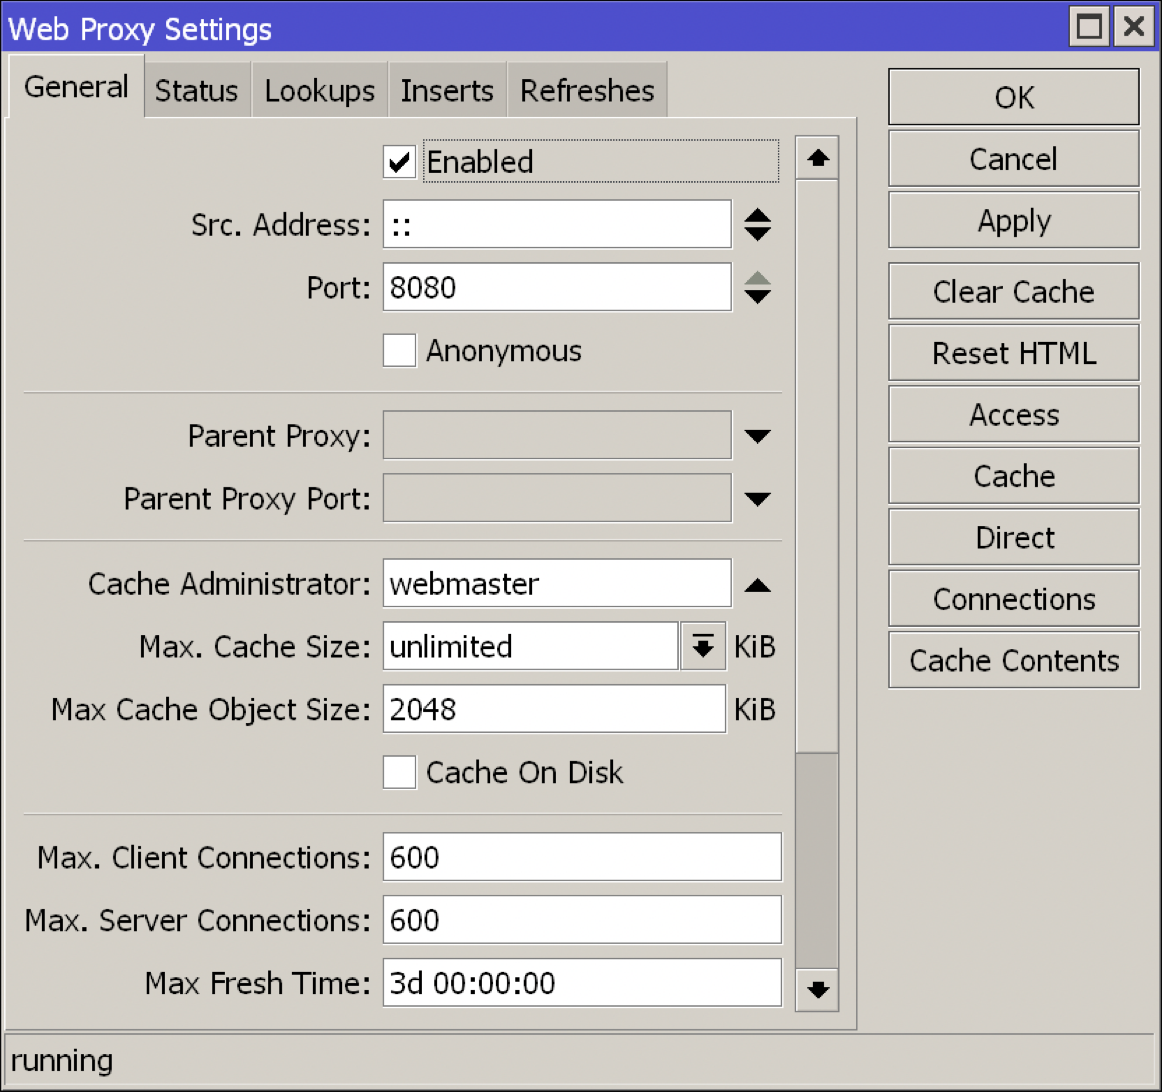
Enable the proxy on port 8080. This screenshot has caching enabled; the command below turns it off for the logging test.
/ip proxy set enabled=yes port=8080 max-cache-size=noneNow add a NAT redirect rule. Replace bridge with the interface on which your test client’s packets enter the router:
/ip firewall nat add chain=dstnat in-interface=bridge \
    src-address=192.168.88.10/32 protocol=tcp dst-port=80 \
    action=redirect to-ports=8080 comment="diary-http-proxy"
Place it before any existing NAT rule that would already match that traffic. Leave port 443 alone.
redirect sends the matching connection to a port on the router itself. The input firewall must therefore permit that client’s redirected connection to 8080. NAT is decided at the start of a connection, so test with a fresh connection after changing a rule. These behaviors are covered in MikroTik’s NAT documentation.
If the proxy won’t enable, check whether your RouterOS device mode permits it. Don’t change device mode blindly on a remote production router.
Receive a message before building the dashboard
Configure your receiver to listen on UDP 3100. If it has a settings screen, the port should match the remote logging action:

An example receiver setting: the listener is enabled on port 3100, matching the router’s destination port.
You can use any receiver that understands the format you’re sending. An HTTP endpoint alone won’t receive these UDP packets.
For a quick check, save this as receive_logs.py on the receiver machine. It only prints messages; it isn’t the application or a production collector.
import socket

BIND_ADDRESS = "192.168.88.20"
ROUTER_ADDRESS = "192.168.88.1"
PORT = 3100

with socket.socket(socket.AF_INET, socket.SOCK_DGRAM) as receiver:
    receiver.bind((BIND_ADDRESS, PORT))
    print(f"Listening on {BIND_ADDRESS}:{PORT}/UDP", flush=True)
    while True:
        payload, sender = receiver.recvfrom(65535)
        if sender[0] != ROUTER_ADDRESS:
            continue
        message = payload.decode("utf-8", errors="replace")
        print(repr(message), flush=True)
BIND_ADDRESS must belong to the receiver machine; ROUTER_ADDRESS is the expected UDP sender. Run it with python3 receive_logs.py. The sender check is a debugging filter, not authentication; keep the receiver on the trusted network with its firewall restriction. If routing makes the router choose another source address, inspect that address before adjusting the filter or the logging action’s src-address.
From the test client, make a plain HTTP request:
curl --noproxy '*' --max-time 10 http://example.com/Don’t follow redirects for this check. An HTTP response redirecting to HTTPS is enough to exercise the initial HTTP request. The receiver should print a message containing the request information. Its exact format depends on your RouterOS version and log format; inspect that real message before writing a parser.
If nothing arrives, work back from the receiver:
| Check | What to look for |
|---|---|
| Receiver | Bound to its LAN address and UDP 3100, not only localhost or TCP |
| Network | Receiver firewall allows the router’s actual source address |
| Logging | WEBLOG has the correct destination; web-proxy,!debug uses it |
| Proxy | /ip proxy monitor once reports a running proxy |
| NAT | /ip firewall nat print stats where comment="diary-http-proxy" shows matching traffic |
| Client | Uses this router as gateway and makes a new IPv4 HTTP connection |
For a temporary local view, add a memory rule, make another request, then inspect /log:
/system logging add topics=web-proxy,!debug action=memory \
    comment="diary-http-check"
/log print where topics~"web-proxy"
Remove that temporary rule when you’ve finished:
/system logging remove [find where comment="diary-http-check"]A remote action doesn’t automatically keep a local copy. MikroTik’s logging guide explains how rules send entries to different actions.
Give the records a useful web interface
Once messages arrive, the application has a fairly ordinary job: parse a record, store it, and provide a queryable view. For a new implementation, I’d start with the received time, router identity, client IP, HTTP method, and host or URL when present. Keep the router’s event time separately if the message provides it, and handle its timezone explicitly.
The source address of the UDP packet identifies the router. The client address has to come from the log message. Mixing those up would make the dashboard suggest that one extremely busy router did all the browsing.
Validate fields before saving them. Treat received text as untrusted when rendering HTML, and don’t turn a URL from a log into an automatic backend fetch. Store only the URL detail you need; query strings can contain private data. Give administrators authenticated access and set a retention period.
Add filters for site, client IP, and date so an administrator can narrow the results:
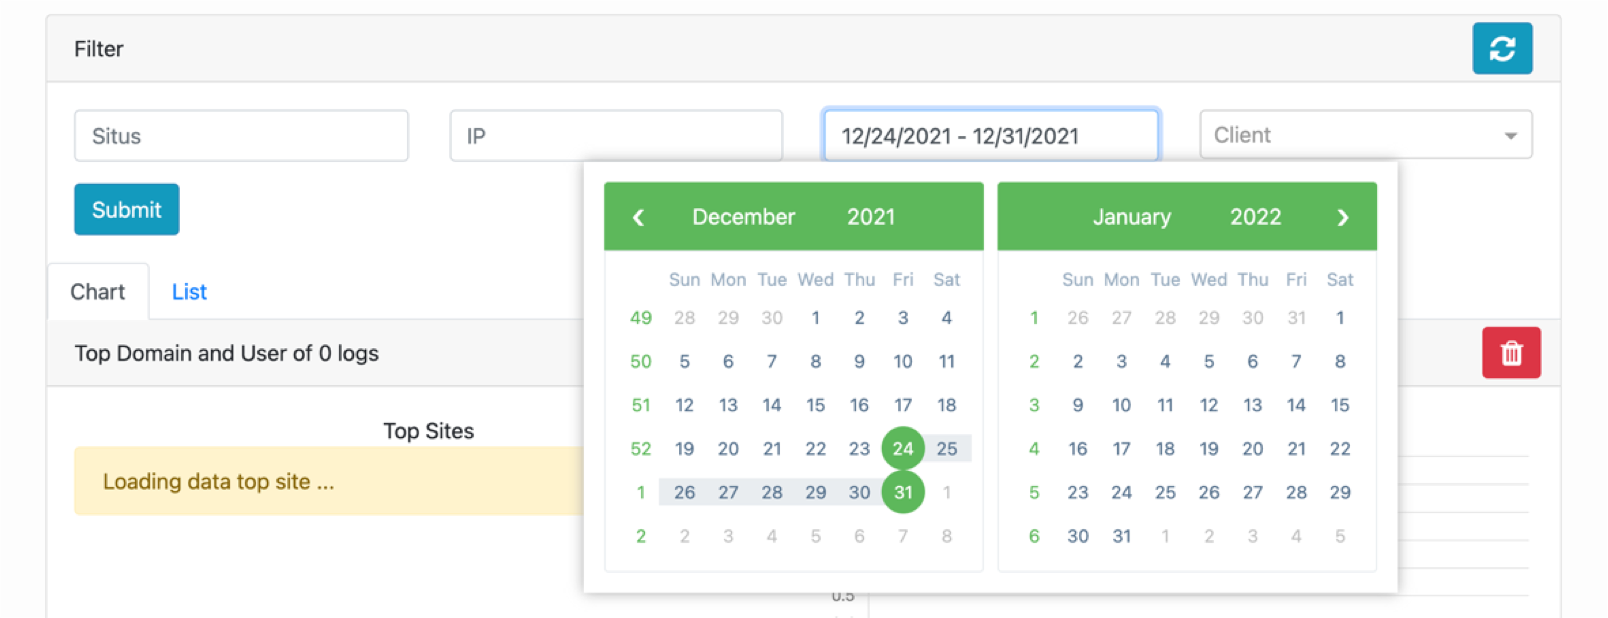
A date-range picker alongside site and client filters. Apply the selected filters to both the request table and any charts.
Those filters give a first version enough to do. Show a table of captured requests, let an administrator narrow the date range, and group matching records by host or client when a chart would help. Label the chart as captured requests so its meaning stays clear.
UDP doesn’t guarantee delivery. A stopped receiver can leave gaps, and this IPv4 HTTP setup also misses traffic that bypasses the proxy, including ordinary HTTPS and IPv6 browsing. An empty result means no matching records were collected, not that somebody never visited a site.
When the lab is finished, disable its redirect and logging rule, then restore the proxy and firewall settings you recorded earlier:
/ip firewall nat disable [find where comment="diary-http-proxy"]
/system logging disable [find where comment="diary-http-log"]
Keep one known HTTP request as your end-to-end check when you start building the real receiver. You should be able to find the same request in the incoming message, the stored record, and the web table.